If you spent March 20 watching $SPY and $QQQ for direction, you were looking at the wrong tickers. Both sat at an FT Score of exactly 50 (Flowlyte's proprietary trend score, where anything above 50 is bullish and anything below is bearish), locked in a volatility squeeze with no directional resolution in sight. The real signal was somewhere else entirely.
That signal was $IEFA.
The International Divergence Nobody Is Talking About
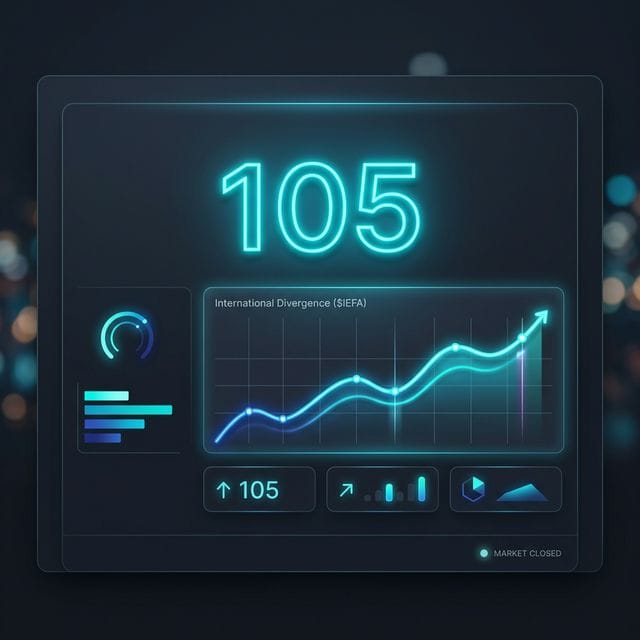
IEFA (the iShares MSCI EAFE ETF, which tracks developed international markets like Europe and Japan) posted an FT Score of 105 today. That is the single highest reading in the entire Flowlyte scan universe. Not a defense contractor. Not a semiconductor stock. An international developed-markets ETF.
Flowlyte's RS Score (a measure of relative strength versus the broader market) confirmed it at 9.2 out of 10. When the FT Score and RS Score align at the top of the feed simultaneously, that is not noise. That is capital rotation. Money is moving out of US tech and into international developed markets in a way the FT Score is capturing before it becomes a mainstream conversation.
Defense Is the Domestic Winner, But Watch the RSI
$LMT logged an FT Score of 103 today with an RSI of 81.4, a reading that technically puts the stock in overbought territory. Up +38% year to date, Lockheed Martin is being powered by a $194 billion backlog and geopolitical tailwinds tied to Operation Epic Fury. The RS Score sits at 9.5, one of the strongest in the feed.
The Industrials sector led all sectors on the day at +1.45%, and LMT is a significant reason why. The data supports the trend, but an RSI above 80 is a moderate risk flag worth tracking. Flowlyte surfaces that automatically so you do not have to hunt for it.
The Regional Bank Setup: 162,000 Contracts and an A+ Bull Signal
The standout domestic flow alert of the session was $KRE. The Regional Banking ETF saw 162,542 call contracts purchased today, 51% above the average daily volume for that options chain. To put that in context: call contracts are bets that a stock or ETF will rise. When institutional traders buy this many in a single session, they are not hedging. They are positioning.
Flowlyte's Sentinel (the AI surveillance engine that monitors every trade across the options market in real time) flagged this immediately. The FT Score sits at 60 (bullish), the Trend Badge is A+ Bull (Flowlyte's highest conviction setup, reserved for rare conditions), and an active volatility squeeze is in place. A squeeze occurs when Bollinger Bands compress inside Keltner Channels. It signals that the stock is coiled and a significant move is likely imminent. The call flow suggests institutional players have already picked their direction.
The SMCI Warning: When Price Lies and Data Tells the Truth
$SMCI gained +4.5% today, the kind of move that triggers momentum alerts across social media and retail trading platforms. Flowlyte's FT Score told a different story: -41. That is deep bearish territory.
This is what Flowlyte calls FVS Divergence: when price action and the underlying flow metrics move in opposite directions. Price goes up. Institutional flow data stays negative. Historically, this pattern resolves in favor of the data, not the price. It is the exact type of setup that separates traders using Flowlyte's Sentinel feed from traders chasing green candles.
Gold and Silver: Highest RS Scores in the Universe, Trend Not Yet Confirmed
$GLD posted an RS Score of 9.73 today. $SLV posted 9.75. Those are the two highest relative strength readings in the entire Flowlyte feed. Volume for GLD ran at 1.54x its average. Volume for SLV ran at 1.40x its average.
But the FT Scores (47 for GLD, 42 for SLV) remain just below the bullish threshold of 50. This is what early accumulation looks like before trend confirmation triggers: elevated volume, exceptional relative strength, and a price that has not yet forced the FT Score above 50. When it does, Flowlyte will surface it.
The Risk Picture
Three risk flags worth noting from today's session: UNG collapsed -22.40% in a single session, a tail-risk event driven by natural gas round-tripping from $30.72/MMBtu in January back toward the $3 range. LMT's RSI at 81.4 warrants caution on new entries at extended prices. And the SPY/QQQ squeeze at FT Score 50 means a large directional move is likely coming, but the data has not yet resolved which way.
What This Means for How You Trade
Today's session was a master class in why looking at the right data changes what you see. IEFA, not SPY, led the feed. KRE's options flow printed a record before most retail traders noticed the chart. SMCI's price popped while its FT Score stayed negative. Gold and silver are loading quietly.
Flowlyte's Sentinel, FT Score, RS Score, and squeeze detection exist to surface exactly these setups, in real time, before they become crowded trades.
This content is for informational and educational purposes only and does not constitute investment advice or a recommendation to buy or sell any security. Always conduct your own research. Past data signals do not guarantee future results.
See everything the Flowlyte feed showed today at flowlyte.app.