All data in this post is as of the Friday, November 14, 2026 close (screens captured the following day). This is an illustration of a research process, not financial advice and not a recommendation to buy or sell any security.
Most stock ideas start in the wrong place: a ticker someone mentioned, a chart that looks exciting, a headline. We prefer to start from the top and earn our way down to a single name. Each step either narrows the field or tells us to slow down.
This week the process led us to a stock our own dashboard ranked as a high-conviction idea. Then the last two steps told us to wait. Here is the whole walk, with the screens we used.
Step 1: What kind of economy are we in?

The macro regime bar reads Boom Phase, but with only 36% confidence. The yield curve is positive at 0.83%. A boom label with low confidence is a "proceed, but do not bet the farm" signal. It favors owning quality businesses over chasing the most speculative names.
Step 2: How settled is the cycle, and is the market paying up for risk?
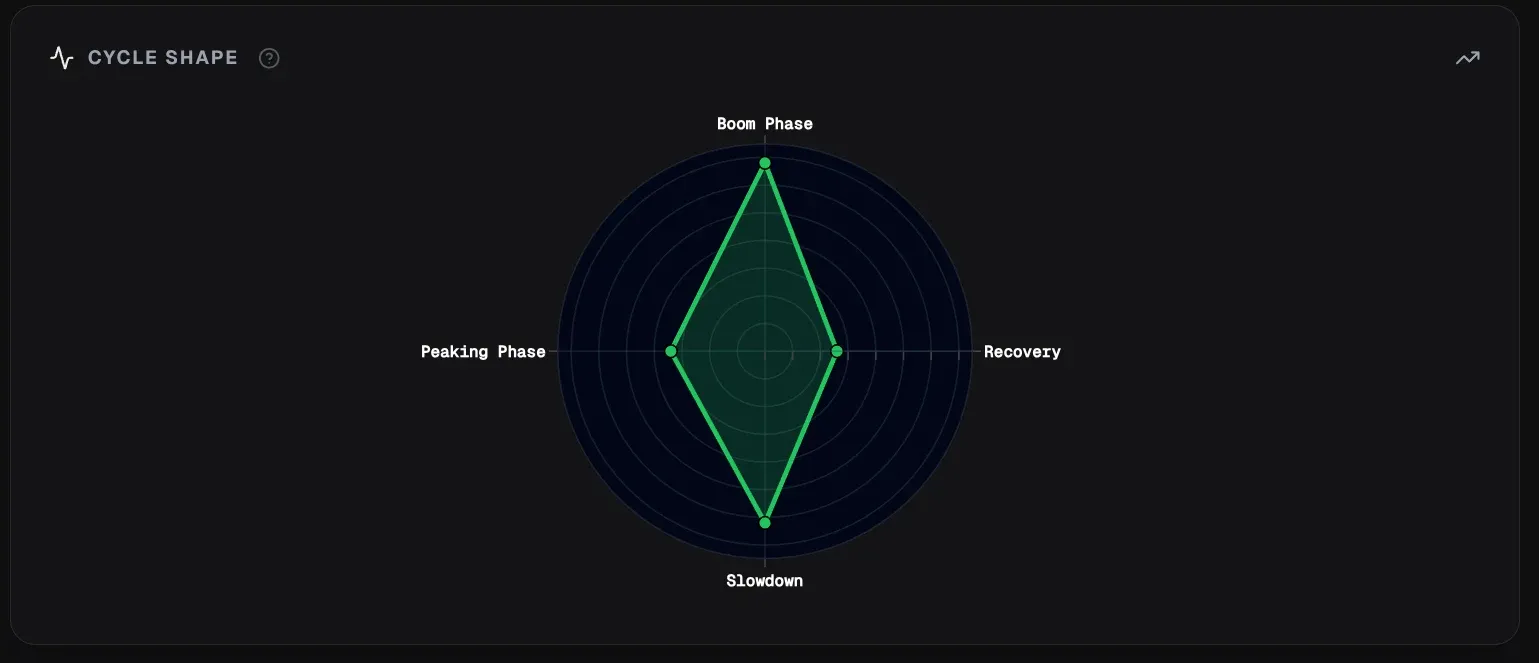
The Cycle Shape chart shows the same macro picture from a different angle. Each spoke is one phase of the business cycle: Recovery, Boom, Peaking and Slowdown. The further the green point sits from the center, the more today's data resembles that phase. A clean, settled cycle looks like a single long spike. A cycle in transition looks stretched in two directions at once.
This week the shape is a tall diamond. Boom reaches furthest, but Slowdown is almost as long, while Peaking and Recovery stay short. In plain terms: the economy still reads as expanding, but a meaningful share of the evidence already looks like a slowdown. That tension is why the Boom label in step 1 carries only 36% confidence.
Risk appetite tells a similar story. Flowlyte's risk-on / risk-off composite sits at +0.25, which the app calls Neutral: investors are not panicking and they are not euphoric. A mixed cycle plus neutral risk appetite is a market where stock selection matters more than simply being long.
Step 3: How many stocks are actually participating?

Breadth is where the picture gets weaker. The advance/decline ratio was 0.52, roughly one stock up for every two down, and the average stock fell 1.50% on the day. The Sentinel Technician's verdict is Narrow Leadership: a few groups are carrying the tape while most of the market drifts.
When leadership is narrow, the job is to find the groups that are doing the carrying, and to be picky inside them.
Step 4: Where is the money going?
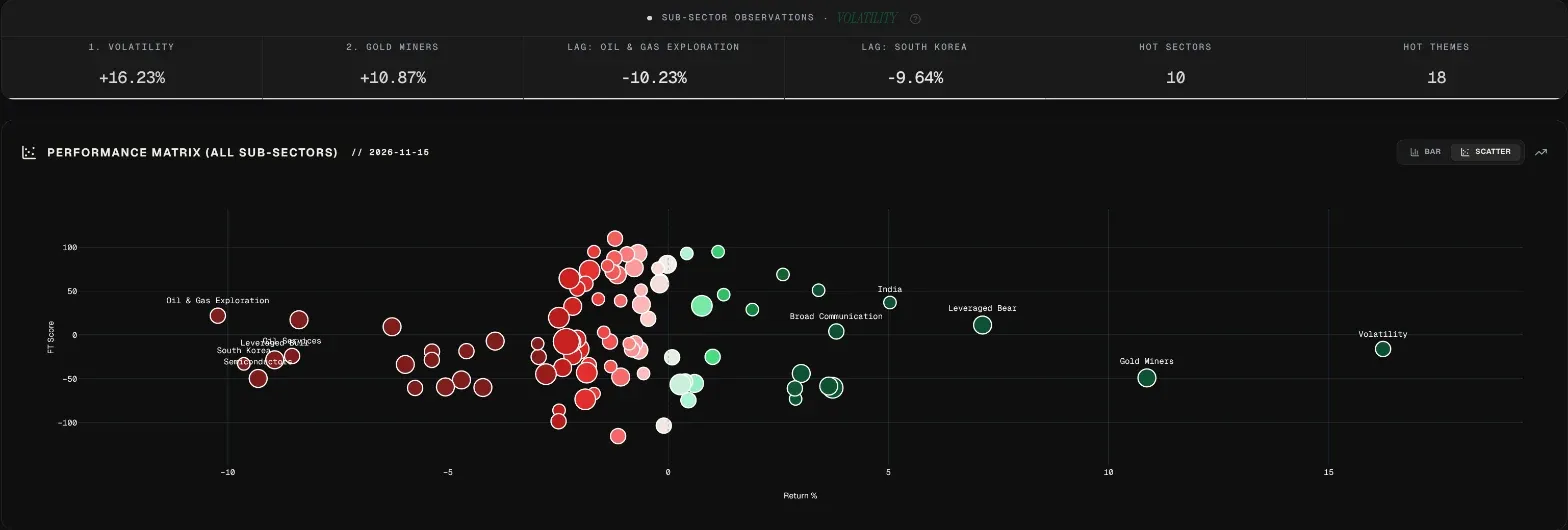
On the Themes page, among themes and sub-sectors, Volatility (+16.23%) and Gold Miners (+10.87%) lead, while Oil and Gas Exploration (-10.23%) and South Korea (-9.64%) lag. Volatility and gold leading together is a hedging tell: people are buying protection, which fits the neutral risk read and the narrow breadth.
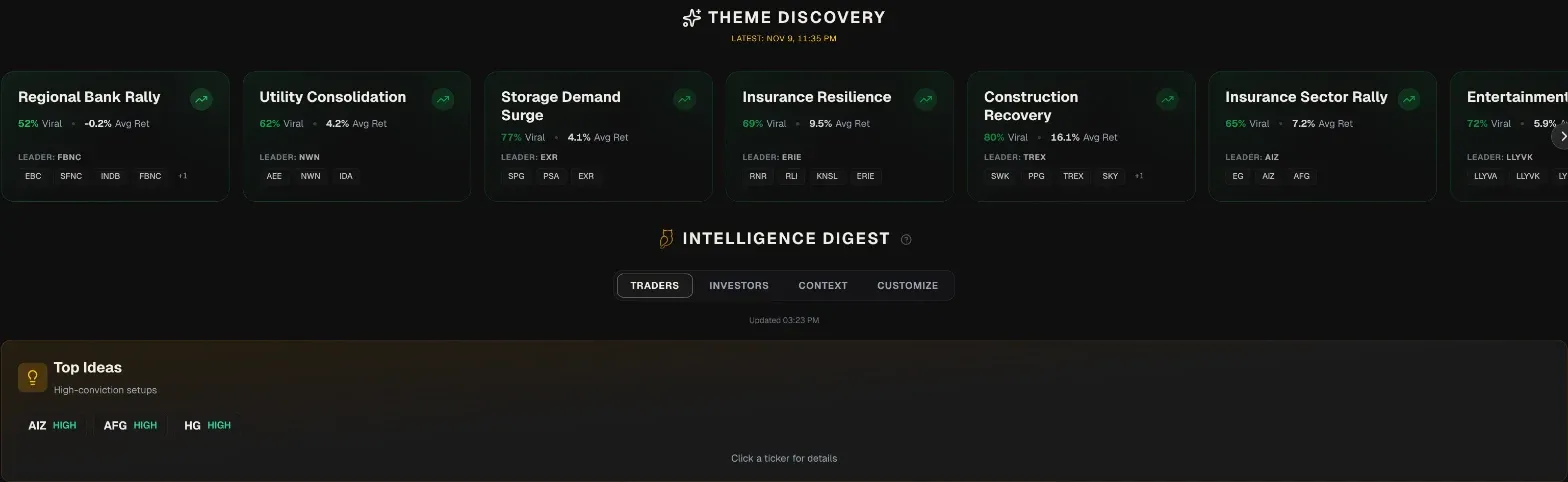
Theme Discovery (latest run Nov 9) surfaced something more useful for a stock picker: insurance shows up twice, as "Insurance Resilience" and "Insurance Sector Rally". Insurers are the kind of defensive, cash-generating business that fits a low-confidence boom with hedging demand. And the dashboard's Top Ideas, rated HIGH, were AIZ, AFG and HG, all insurers.
So the funnel had narrowed from the whole market to one industry, and from there to one name to examine first: Assurant (AIZ), the leader of the Insurance Sector Rally theme.
Step 5: Is the business actually good?
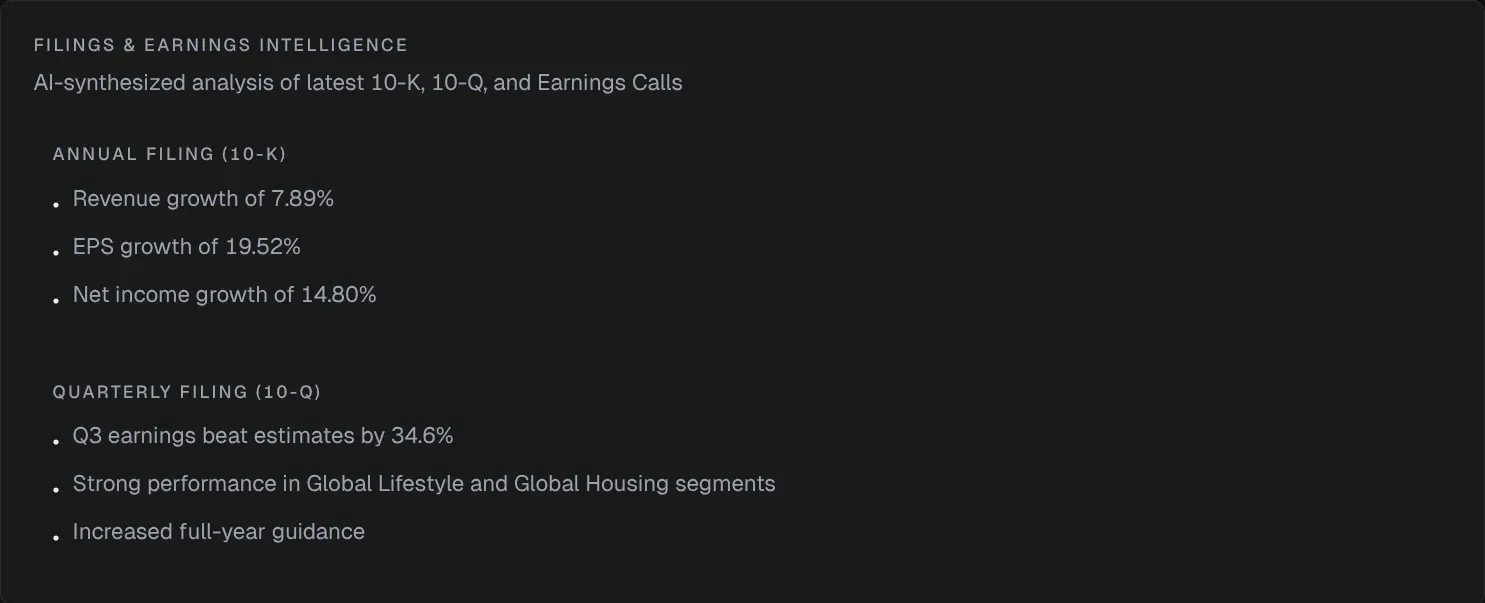
On fundamentals, AIZ holds up well. Over the last fiscal year revenue grew 7.89%, EPS grew 19.52% and net income grew 14.80%. The latest quarter beat estimates by 34.6% and the company raised full-year guidance. Return on equity is 18.0% and beta is 0.52, so the stock has historically moved about half as much as the market.
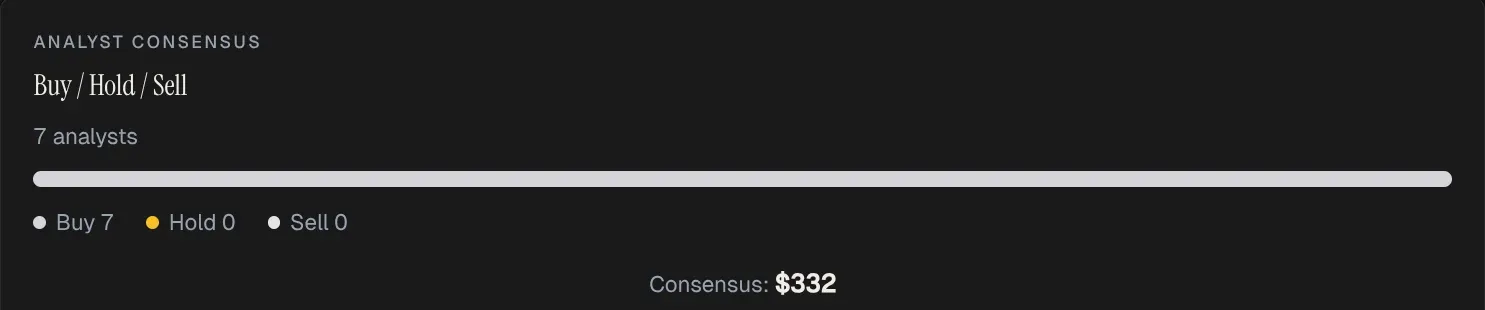
The Street agrees: 7 Buy, 0 Hold, 0 Sell, with a consensus target of $332 (range $310 to $356). With the stock at $322.11, that consensus implies about 3% upside. Strong agreement with little upside left is a pattern worth noticing: a lot of the good news may already be in the price.
Step 6: What are insiders doing?

On November 10, two executive vice presidents sold: 3,901 shares at $319.37 (about $1.25M) and 3,272 shares at $319.84 (about $1.05M), roughly $2.3M combined. Insider selling has many innocent explanations (taxes, diversification, scheduled plans), so on its own it is not a red flag. But it is not a vote of confidence at these prices either.
Step 7: Is the timing right?


This is the step that changed our mind.
- WillVal: 97 out of 100, OVER. WillVal compares a stock's valuation to its sector benchmark (here, XLF). 0 is cheap, 50 is fair, 100 is rich. At 97, AIZ sits near the rich end of its range relative to financials.
- POIV: hidden bearish divergence. Volume flow is not confirming the price strength.
- Stochastic at 90 and falling, ADX at 49.8 and rising. The trend is very strong, but short-term momentum is rolling over from overbought.
Put together: a great company in a strong trend, priced rich against its peers, with insiders trimming and momentum starting to fade. That is a good business at a less attractive moment.
The decision: pass for now
AIZ earned its Top Ideas spot on trend and quality. But "high conviction" in a trend model is not the same as "good entry today". Our process says wait on AIZ at these levels. We would revisit it if the valuation gauge cools off or the momentum resets.
The more useful output of the process is what it pointed to next. Other large property and casualty insurers still screen fair on WillVal, sector-relative, as of the Nov 14 close:
| Ticker | Company | WillVal (lower is cheaper) | Band |
|---|---|---|---|
| HIG | The Hartford | 27 | Fair |
| CB | Chubb | 53 | Fair |
| TRV | Travelers | 56 | Fair |
These are a watch list, not buy signals. They go through the same steps 5 to 7 before anything else happens.
Why this process matters
Every step here is a filter you can run in a few minutes in Flowlyte: regime, risk appetite, breadth, themes, fundamentals, insiders and timing. The point is not that the process always says yes. This week, the most valuable thing it did was say "not yet" about our own top pick, and surface other names to put through the same checks.
Data as of the November 14, 2026 close. Flowlyte provides market data and analytics for informational and educational purposes only. Nothing in this post is investment advice or a recommendation to buy or sell any security. Do your own research and consider speaking with a licensed advisor.